Road safety camera fine trends
Data showing the trend in fines for each of the 7 highways since the road safety cameras began operating.
On this page
- CityLink fine trends
- EastLink fine trends
- Geelong Road fine trends
- Hume Freeway fine trends
- Monash Freeway fine trends
- Peninsula Link fine trends
- Western Ring Road fine trends
The following graphs show trends in fines for each of the 7 highways since the cameras began operating:
- CityLink
- EastLink
- Geelong Road
- Hume Freeway
- Monash
- Peninsula Link
- Western Ring Road
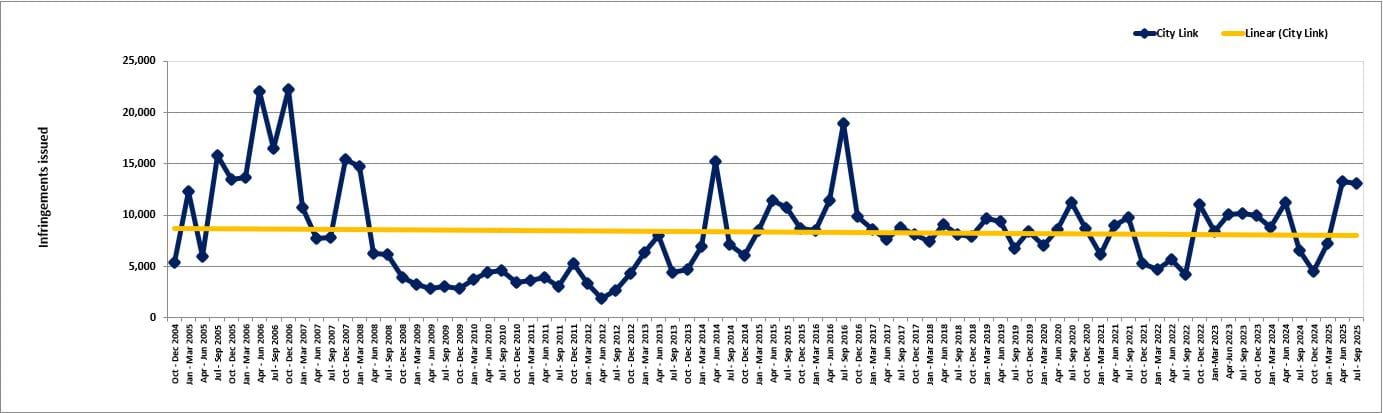
CityLink fine trends
CityLink – trends in fines – October 2004 to September 2025
Trends in fines by Citylink - October 2004 to September 2025 Excel 23.48 KB (opens in a new window)
- Infringements are recorded at the offence date.
- Tolling offences are excluded.
- The data includes infringements issued for speeding and unregistered vehicle offences.
- The infringement numbers reported in quarters 1 and 2, 2011–12 were affected by the Victoria Police Association work bans.
- Roadworks or camera maintenance may influence the number of infringements issued.
- The number of infringements issued may be subject to variation over time as infringements may be withdrawn or reissued.
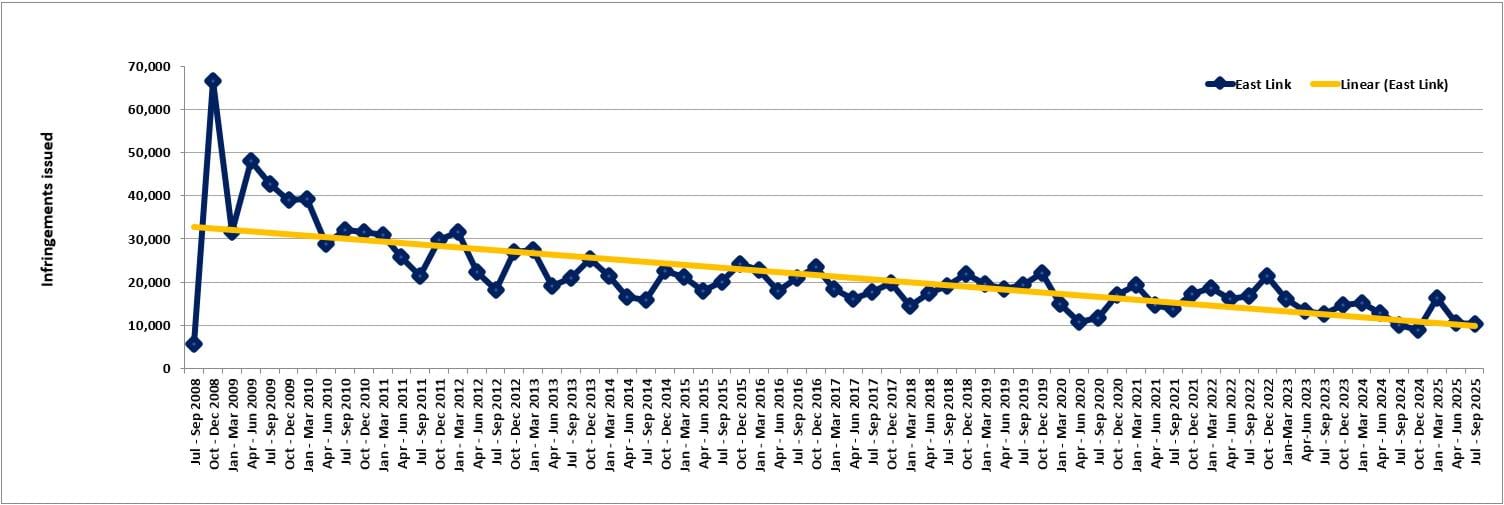
EastLink fine trends
EastLink – trends in fines – July 2008 to September 2025
EastLink - trends in fines - July 2008 to September 2025 Excel 22.3 KB (opens in a new window)
- Infringements are recorded at the offence date.
- Tolling offences are excluded.
- The data includes infringements issued for speeding and unregistered vehicle offences.
- The infringement numbers reported in quarters 1 and 2, 2011-12 were affected by the Victoria Police Association work bans.
- Roadworks or camera maintenance may influence the number of infringements issued.
- The number of infringements issued may be subject to variation over time as infringements may be withdrawn or reissued.
Geelong Road fine trends
Geelong Road – trends in fines – January 2006 to September 2025
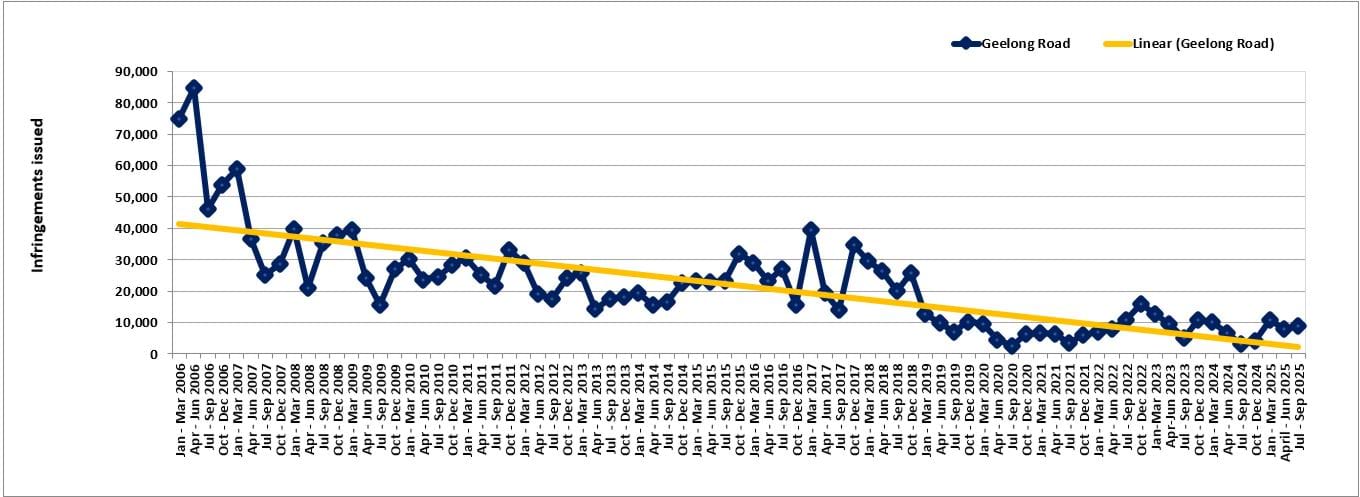
- Infringements are recorded at the offence date.
- The data includes infringements issued for speeding and unregistered vehicle offences.
- The infringement numbers reported in quarters 1 and 2, 2011–12 were affected by the Victoria Police Association work bans.
- Roadworks or camera maintenance may influence the number of infringements issued.
- The number of infringements issued may be subject to variation over time as infringements may be withdrawn or reissued.
Hume Freeway fine trends
Hume Freeway – trends in fines – April 2007 to September 2025
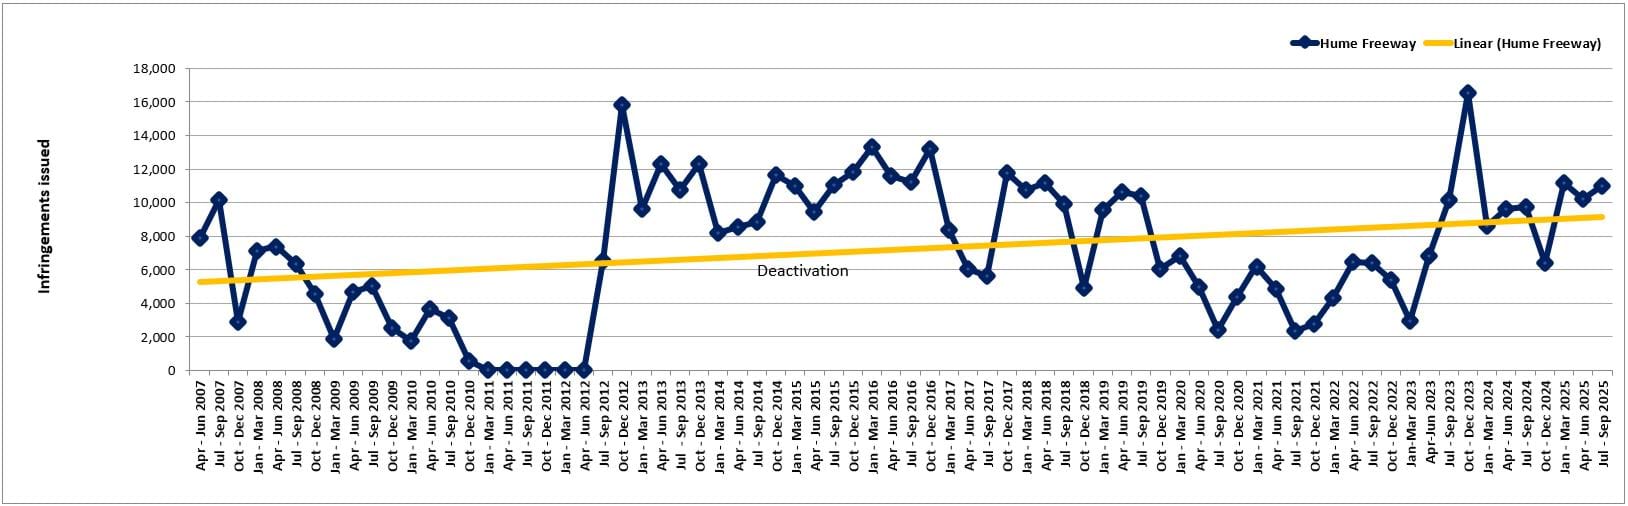
- Infringements are recorded at the offence date.
- The data includes infringements issued for speeding and unregistered vehicle offences.
- On 14 October 2010, Victoria Police suspended use of all point-to-point cameras on the Hume Freeway due to a technical software fault.
- Following extensive testing and system improvements, Victoria Police reactivated the Hume cameras in August 2012.
- Roadworks or camera maintenance may influence the number of infringements issued.
- The number of infringements issued may be subject to variation over time as infringements may be withdrawn or reissued.
Monash Freeway fine trends
Monash Freeway – trends in fines – January 2014 to September 2025
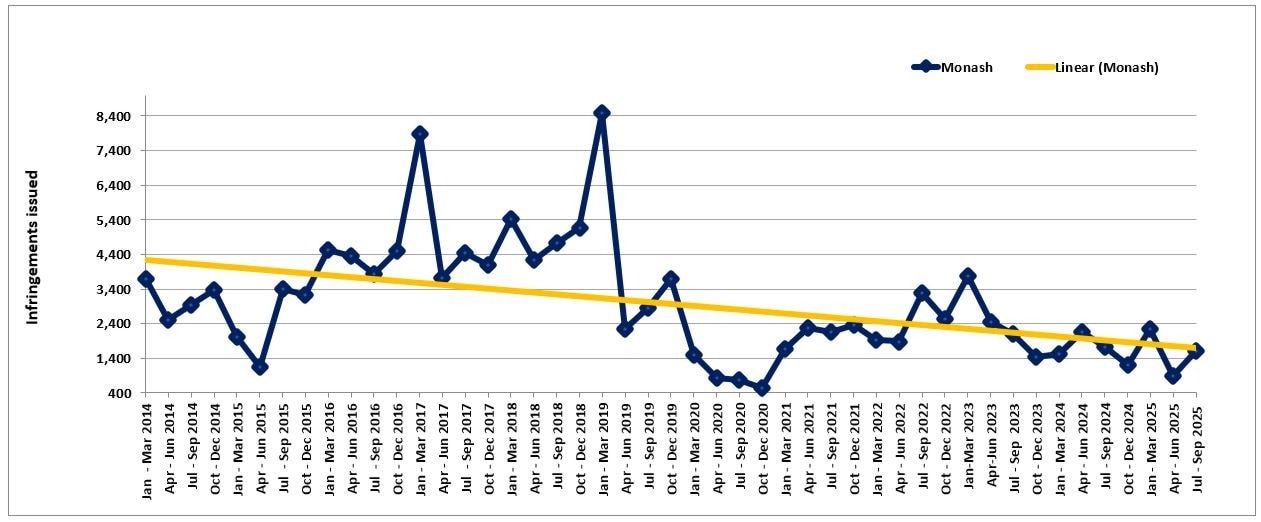
- Infringements are recorded at the offence date.
- The data includes infringements issued for speeding and unregistered vehicle offences.
- Roadworks or camera maintenance may influence the number of infringements issued.
- The number of infringements issued may be subject to variation over time as infringements may be withdrawn or reissued.
- Issuing of infringements in Monash commenced in January 2014.
Peninsula Link fine trends
Peninsula Link – trends in fines – July 2013 to September 2025
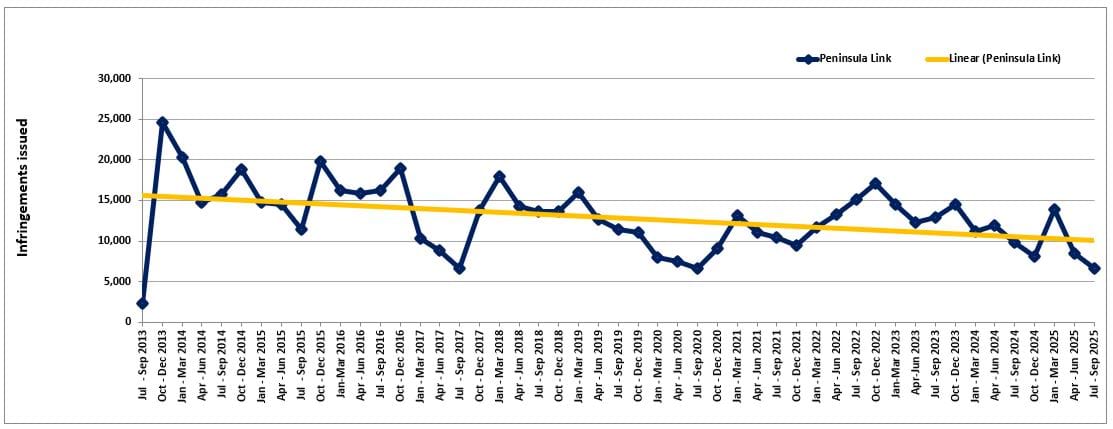
- Infringements are recorded at the offence date.
- The data includes infringements issued for speeding and unregistered vehicle offences.
- Roadworks or camera maintenance may influence the number of infringements issued.
- The number of infringements issued may be subject to variation over time as infringements may be withdrawn or reissued.
- Issuing of infringements in Peninsula Link commenced in September 2013.
Western Ring Road fine trends
Western Ring Road – trends in fines – April 2007 to September 2025
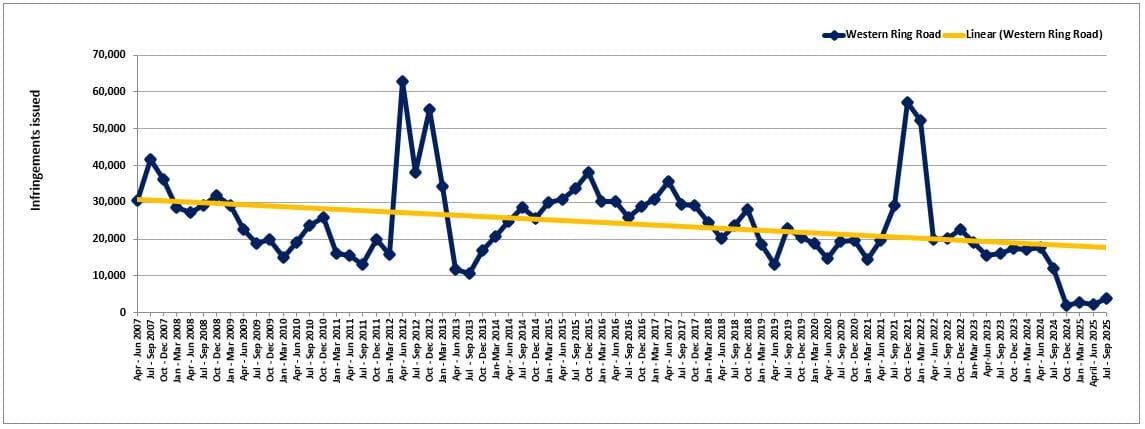
- Infringements are recorded at the offence date.
- The data includes infringements issued for speeding and unregistered vehicle offences.
- The infringement numbers reported in quarters 1 and 2, 2011–12 were affected by the Victoria Police Association work bans.
- Two additional camera sites have been upgraded and re-activated in April 2012.
- Roadworks or camera maintenance may influence the number of infringements issued.
- The number of infringements issued may be subject to variation over time as infringements may be withdrawn or reissued.
Updated 10 April 2026
About the VIC Government
- The Premier and ministers
- Find a Vic Gov department, agency or service
- Strategies and policies
- Inquiries and royal commissions
Grants and programs
Jobs and careers
Arts, culture and heritage
Business and the workplace
- Mentally Healthy Workplaces Framework
- Portable Long Service Authority
- Victoria’s racing industry
- Workforce Inspectorate Victoria
- Liquor licensing, sale and supply
Communities
- Children
- First Peoples - State Relations
- Finding records
- Gender equality & women’s leadership
- LGBTIQA+ equality
- Multicultural communities
- Seniors Online
- Veterans support and commemoration
- Volunteering in Victoria
- Youth Central
Education and training
- Victorian Early Childhood Regulatory Authority
- Early childhood education – information for professionals
- Kinder: Best Start, Best Life
- Education – information for parents
- Schools.Vic - information for schools
- Education grants, programs, awards and events
- PROTECT
- TAFE, training and universities sector
- TAFE Victoria
- Victorian Skills Authority
- Apprenticeships Victoria
- Learn Local
Environment, water and energy
Finance and economy
Health and social support
- Family violence reform
- NDIS Worker Screening Check
- NDIS and disability services and support in Victoria
- Patient Review Panel
- Transforming Trauma Victoria
Housing and property
Law and justice
- Adoption
- Births, deaths and marriages
- Honorary justices
- Machete ban
- Safeguarding Victorians against terrorism
- Stolen Generations Reparations Package
- Victims of Crime
- Victorian Racing Tribunal
Safety and emergencies
- Emergency Recovery Victoria
- Victorian Emergency Relief and Recovery Foundation
- Emergency Recovery Resource Portal
- How well do you know fire
- Fire Services Reform
- Water safety
- Marine Search and Rescue
Science and technology
- Data sharing and open data
- Data.vic - discover and access Vic Gov open data
- Developer.Vic - portal for API developers
- Go.vic URL shortener
- Vic Gov IT project dashboard
- Victoria’s free public wi-fi network
- Cyber security in the Victorian Government
Sport and recreation
Traffic and transport
- Cameras Save Lives
- Transport Fines
- Getting Around
- Transport Planning
- Transport Future
- Climate Change and transport
- Future Directions For Transport
- Transport projects
- Ports and Freight
Working in the Victorian Government
- Single Digital Presence home
- Accommodation and Library Services
- Executive employment in the Victorian public sector
- Budget, procurement and funding
- Careers in the Victorian Government
- Council and Regulator Toolkit
- Guidelines for working in government
- Join a government network
- Standards and guidelines
- VicFleet CarPool
- Victorian Government style guide